
Alibaba Java诊断工具Arthas
目录
前言
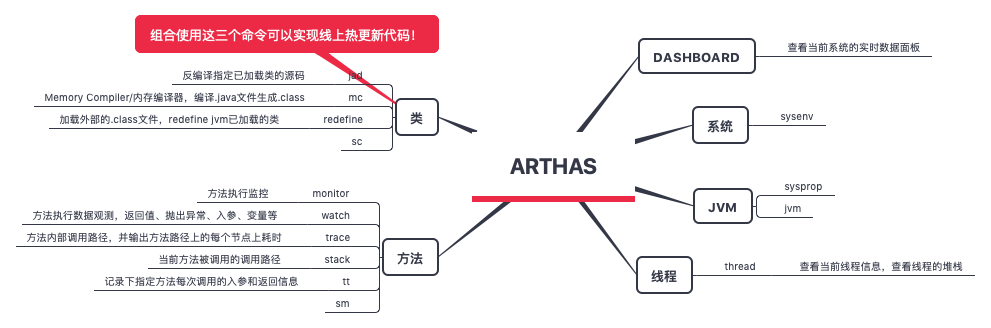
基本上静态分析可以做的事情,arthas 也做到了,athars 运行后也会提供一些metrics 数据,可以采集后进行动态分析。
线上常见问题排查手册 arthas idea plugin 这个解决问题的创新、死磕精神特别牛逼。如何使用Arthas提高日常开发效率?
dashboard 与 JVM 运行指标
https://qiyeyun.gitbook.io/yyydata/jvm/jvm-yun-hang-zhi-biao
热更新代码
Step1 jad命令反编译到磁盘文件
jad --source-only demo.MathGame > /tmp/MathGame.java
Step2 使用文本编辑器修改代码
vi /tmp/MathGame.java
public static void print(int number, List<Integer> primeFactors) {
    StringBuffer sb = new StringBuffer("" + number + "=");
    Iterator<Integer> iterator = primeFactors.iterator();
    while (iterator.hasNext()) {
        int factor = iterator.next();
        sb.append(factor).append('*');
    }
    if (sb.charAt(sb.length() - 1) == '*') {
        sb.deleteCharAt(sb.length() - 1);
    }
    System.out.println("MyTest.......");
}
Step3 mc命令来内存编译修改过的代码
$ mc /tmp/MathGame.java -d /tmp
Memory compiler output:
/tmp/demo/MathGame.class
Step4 用redefine命令加载新的字节码
$ redefine /tmp/demo/MathGame.class
redefine success, size: 1
现在看一下程序日志
illegalArgumentCount:96218, number is: -169877, need >= 2
illegalArgumentCount:96219, number is: -57731, need >= 2
MyTest.......
illegalArgumentCount:96220, number is: -207843, need >= 2
illegalArgumentCount:96221, number is: -193695, need >= 2
MyTest.......
illegalArgumentCount:96222, number is: -19514, need >= 2
illegalArgumentCount:96223, number is: -199441, need >= 2
illegalArgumentCount:96224, number is: -110791, need >= 2
MyTest.......
illegalArgumentCount:96225, number is: -116154, need >= 2
MyTest.......
MyTest.......
MyTest.......
MyTest.......
MyTest.......
MyTest.......
jvm attach 机制
JVM Attach机制实现Attach机制是jvm提供一种jvm进程间通信(这里用的是套接字socket)的能力,能让一个进程传命令给另外一个进程,并让它执行内部的一些操作。
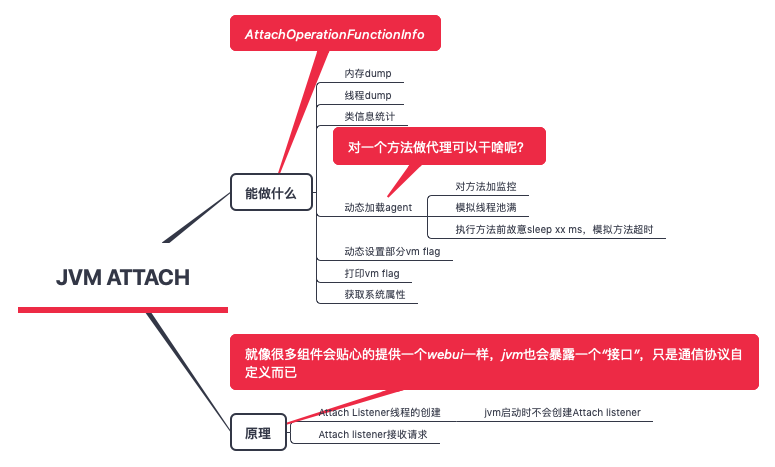
static AttachOperationFunctionInfo funcs[] = {
    { "agentProperties",  get_agent_properties },
    { "datadump",         data_dump },
    { "dumpheap",         dump_heap },
    { "load",             JvmtiExport::load_agent_library },
    { "properties",       get_system_properties },
    { "threaddump",       thread_dump },
    { "inspectheap",      heap_inspection },
    { "setflag",          set_flag },
    { "printflag",        print_flag },
    { "jcmd",             jcmd },
    { NULL,               NULL }
};
Attach_listener 线程的逻辑
static void Attach_listener_thread_entry(JavaThread* thread, TRAPS) {
    ...
    for (;;) {
        AttachOperation* op = AttachListener::dequeue();
        ...
        // find the function to dispatch too
        AttachOperationFunctionInfo* info = NULL;
        for (int i=0; funcs[i].name != NULL; i++) {
            const char* name = funcs[i].name;
            assert(strlen(name) <= AttachOperation::name_length_max, "operation <= name_length_max");
            if (strcmp(op->name(), name) == 0) {
                info = &(funcs[i]);
                break;
            }
        }
        // check for platform dependent Attach operation
        if (info == NULL) {
            info = AttachListener::pd_find_operation(op->name());
        }
        if (info != NULL) {
            // dispatch to the function that implements this operation
            res = (info->func)(op, &st);
        } else {
            st.print("Operation %s not recognized!", op->name());
            res = JNI_ERR;
        }
        // operation complete - send result and output to client
        op->complete(res, &st);
    }
}
- 从队列里不断取AttachOperation
- 根据 AttachOperation 得到 AttachOperationFunctionInfo
- 执行AttachOperationFunctionInfo 对应的方法并返回结果
排查示例
使用 Arthas 排查 SpringBoot 诡异耗时的 Bug
一个网络问题排查
现象: rpc客户端read timeout。 那么问题可能出在网络层、rpc框架层和上层业务方
监控本机 eth0 网卡与目标主机的往来数据包tcpdump -i eth0 -nn 'host 目标主机ip'
可以观察到 在客户端数据发出后,服务端很快回复了ack,说明数据包顺利送达到了 服务端。但服务端的响应在很长时间之后才返回。 所以初步定位是服务端处理的问题
观察服务端日志,已知的业务日志收到请求的时间与 网络抓包的时间间隔很长(这里值得学习的一点就是网络抓包时间与 服务日志时间放在一起比对,以前没这么想过),基本可以判断问题出在 接收数据包与 框架调用业务逻辑之间,即出在框架层。
然后再使用arthas trace 指令跟踪框架层入口方法的执行逻辑,即可查看哪一个步骤执行的耗时时间最长。
启动/类加载失败
开发报错:java.lang.IllegalStateException: Failed to introspect Class [类全名] from ClassLoader xx,
怀疑是 classpath 下有多个jar 包含该类,通过 arthas sc -d 类全名 找到此次加载类所用的 jar 名,到classpath 下检索,jar -vtf jar名称 | grep 类全名 发现了相关的多个jar 都包含 该类。
tomcat 假死
arthas thread 可以查看jvm 所有线程的状态:
thread Threads Total: 512, NEW: 0, RUNNABLE: 175, BLOCKED: 0, WAITING: 229, TIMED_WAITING: 101, TERMINATED: 0, Internal threads: 7
发现 WAITING 和 TIMED_WAITING 线程较多,猜测有可能是 tomcat 线程池耗尽进而无法接受新的请求。根据线程 stack 发现这些线程都执行了 xx.park,进而可以确定引起 park的位置。